Everything you do (and say, and write) on Facebook is in Sweden
When you post a photo on Facebook or share a status with your “virtual” friends, what you have just created – your data – do not remain wandering around in space, in an abstract or immaterial place. They have a little trip pending to the Swedish city of Lulea, which is the location of the largest Facebook data centre outside of the USA. Messages, interests, “likes”, hobbies, shared friends: all rest in a vast structure that is charged with maintaining and preserving this information that you have produced and shared. Storing it has a price and a cost in terms of energy, and they take advantage of the arctic cold to save on air conditioning.
Egos, webcams and YouTube
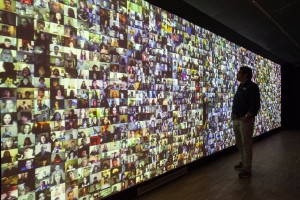
What would happen if we put together on an immense mural with fragments of some of the clips you have seen on YouTube in recent years? Cookery recipes, political speeches, political arguments, in favour, against, declarations of love, beauty tips, covers of songs, Photoshop tutorials. Everyone wants to feel they are being listened to and YouTube is the great mixed bag of the web world where everyone can say their bit. So, to a certain extent this is the experiment involved in “Hello world! Or: how I learned to stop listening and love noise”, by Christopher Baker, an awe-inspiring mural that you can see at BBD, formed based on small and diverse clips, varied miscellany, from over 5000 personal diaries found on the Internet. You will not be able to hear anything, you will probably not understand a single word, the general cacophony and the constant blablabla will only serve to make you realise that inside the immensity of the Internet, everyone can talk about everything.
The room full of Flickr photos
Right at the very moment that you “click” to upload a new photo to Flickr, over a half a million people make – or have made or will make – exactly the same movement in the next 24 hours. The volume of “clicks” is so extraordinary as to fill an entire room with photographs. This is shown by the installation “24 hrs in photos” by Dutch collector and photographer Eric Kessels, which you will also find at the exhibition, and which immerses you (literally) in a sea of the photographs taken and uploaded to Flickr in 24 hours. Perhaps you haver never given it much thought, but the 356 photos that you are storing in your mobile are a minuscule percentage in relation to the global quantity of visual data that we manufacture daily.
Data can tell you how your sex life is going
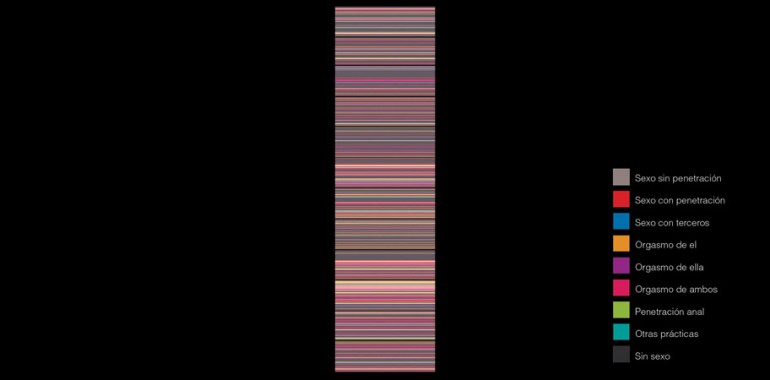
 One of the most surprising installations at BBD is that produced by Jaime Serra, an expert in infographics at La Vanguardia, who shows through a simple graphic the state of his relationship with his partner and their level of sexual activity during a one-year period. Based on coloured lines (and with the indefatigable help of his wife, who compiled all the data), Serra draws a map of his relationship with his partner. A good example of how the visualisation of data based on infographics and maps can help us understand or interpret reality. Nicholas Feltron also does a similar exercise wtih the yearbook Feltron (2012), a book in which this New York data expert “mapifies” in a scrupulous, slightly obsessive way, his life during an entire year: the top 10 people he has most talked, the issues he has talked about most, the airports he has passed through, the volume of photographs he has taken or, even, the food he has eaten.
Data for the common good
The dissemination of our data has its drawbacks, clearly. Espionage or the use made of them by major companies and corporations represents a growing threat to our privacy. Even so, foundations exist, such as Civio, that propose a “benign” use of data and call for a journalism committed to citizens and the freedom of data, or “open data”. At the exhibition you can discover some of the tools Civio offers, such as “Donde van mis impuestos” (Where do my taxes go?), which serves to see in a clear and very illustrative way where our taxes have been going since 2008 and up to the present day or “Tu tasa de paro” (Your unemployment rate) based on the Active Population Survey (EPA), to find out the unemployment rate according to age, sex and location in Spain.
The Big Bang Data exhibition can be visited at the CCCB until 26 October, from Tuesday to Sunday from 11 a.m. to 8 p.m. and followed via #BBDATA and on the website http://bigbangdata.cccb.org


